Using StoreFries for Facebook Analytics
Facebook Analytics is a vital tool for businesses seeking to understand and optimize their presence on the platform. With StoreFries' integrated Facebook Analytics, you have access to a wealth of data that can drive informed decisions. In this guide, we'll walk you through the key metrics and insights available in StoreFries for Facebook Analytics, empowering you to elevate your social media strategy.
Summary:
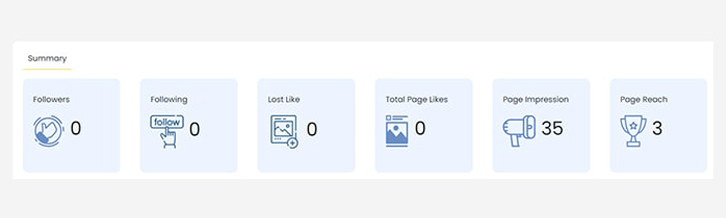
Total Followers: The total number of followers on your facebook page can be viewed here.
Total Following: The total number of pages followed by your page can be viewed here.
Lost Likes: The number of likes lost over a period of time, and the average lost per day.
Total Page Likes: The total number of likes for your Facebook page.
Total Page Impressions: reflects the total number of times content from your page appeared on someone's screen in the last 30 days.
Post & Engagement Summary:
Demonstrates the activity level on your page
Total Posts: The total number of posts on your Facebook page and the average posts per day.
Total Engagement: The total engagement received on your posts and the average engagement per day.
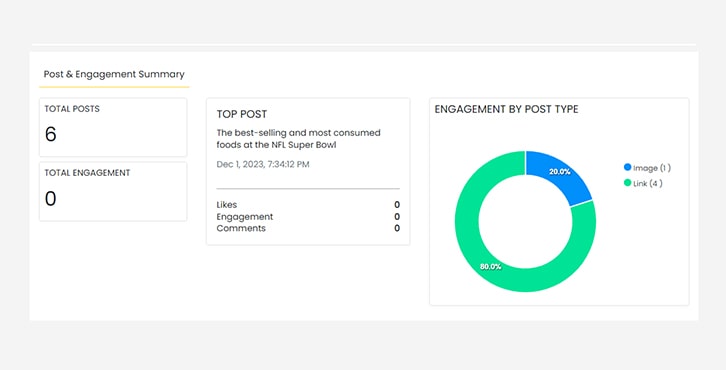
Top Post:
Engagement by Post Type
The distribution of the different types of posts like image, link, text, and video can be viewed here.
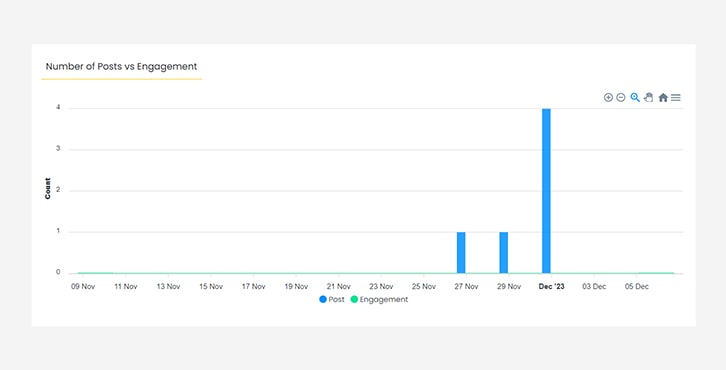
Number of posts vs engagement
The number of posts made on your Facebook page and the total engagement received for the posts over a period of time. The average number of posts published per day can also be viewed.
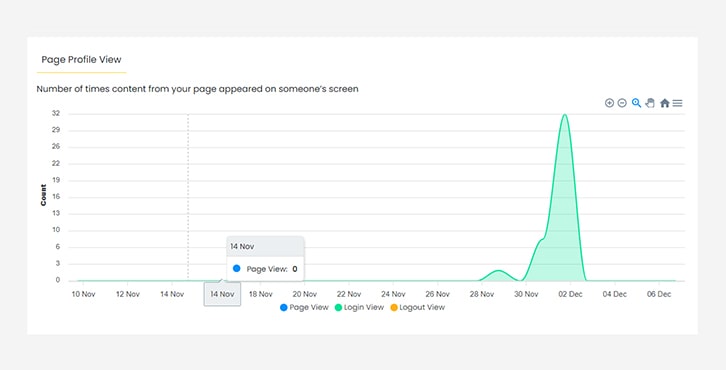
Page Profile View
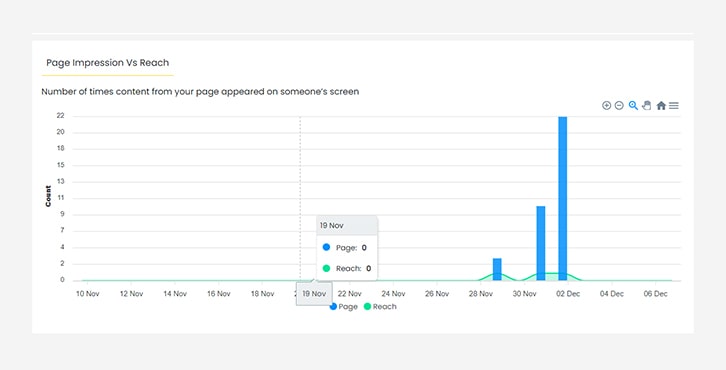
Number of times content from your page appeared on someone’s screen
Page Impression vs Reach
The comparison of the total number of times your page posts were displayed on the users' screens with the number of people who viewed the page over a period of time.
Visualise Performance Over Time Frames:
The Reports module within StoreFries Analytics offers a comprehensive view of your social media channels' performance. A standout feature is the ability to filter data based on specific date ranges. This capability allows you to focus on the metrics that matter most to you.
- Go to the Analytics module.
- In the top right corner there will be an option to select the time range.
- In the drop-down list, you can choose from Today,Yesterday,This week,last 30 days,Custom date range analytics report.
- click Analyze.
With StoreFries' integrated Facebook Analytics, you can dive into the specifics of your Facebook page's performance, gaining insights that can shape your content strategy, engagement tactics, and overall presence on the platform. Stay tuned for more updates and tips on how to leverage Facebook Analytics for optimal results.
Page Views: