LinkedIn is not just a platform, it's a powerful tool for professional growth and
networking. StoreFries offers robust analytics to help you understand and harness
the potential of your LinkedIn presence. Here’s a breakdown of the insightful reports
available
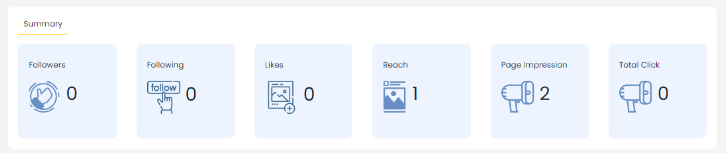
Summary
Note :
"These analytics are crucial in understanding the performance and impact of your
content on LinkedIn. By monitoring these metrics, you can refine your content strategy
to better engage your audience and achieve your professional goals."
Followers: The number of followers on your LinkedIn company profile.
Following: The number of profiles followed by your company profile.
Likes: Likes represent the number of times your content has been
appreciated by your audience.
Reach: Reach measures the total number of unique users who have seen
your content. It reflects the potential exposure and visibility of your posts to a
wider audience.
Page Impressions: Page Impressions signify the total number of times your
content, including posts, page, and updates, has been viewed by users.
Total Clicks: Total Clicks indicate the number of times users have interacted
with your content by clicking on it.
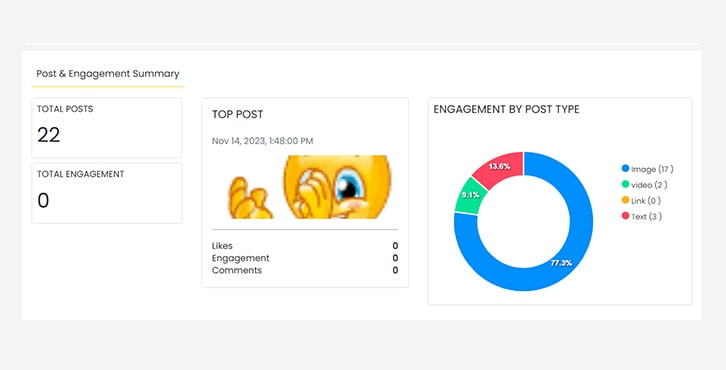
Engagement Summary
Total Posts: Number of posts and daily average.
Total Engagement: Overall engagement and daily average.
Top Post: The highest performing post with detailed statistics.
Engagement by Post Type: Distribution of engagement for various post types.
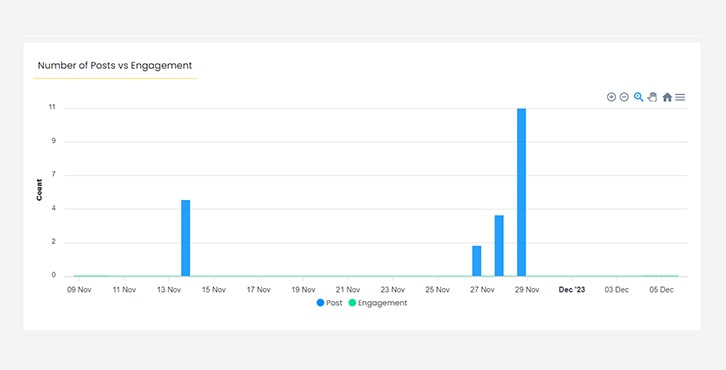
Posts & Engagement Reports
Number of Posts vs Engagement
Comparison of posts published and engagement received.
Posts by:
Type: Distribution of post types (e.g., image, link, video).
Top Posts
Highest performing posts based on various engagement metrics.
Engagement by Post Type
Distribution of engagement received for different post types.
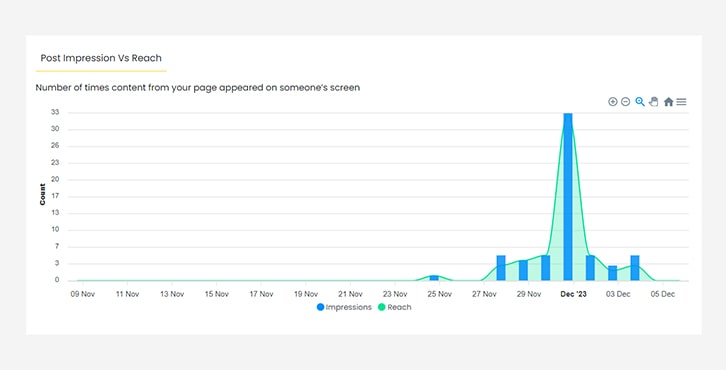
Post Impressions vs Reach
Comparison of post displays and actual views.
Visualise Performance Over Time Frames:
The Reports module within StoreFries Analytics offers a comprehensive view of your
social media channels' performance. A standout feature is the ability to filter data
based on specific date ranges. This capability allows you to focus on the metrics
that matter most to you.
Go to the Analytics module.
In the top right corner there will be an option to select the time range.
In the drop-down list, you can choose from Today, Yesterday, This week, last
30 days, Custom date range analytics report.
click Analyze.
Post Clicks
Total clicks received on your posts.
With StoreFries analytics, you're equipped with a comprehensive toolkit to make
informed decisions, refine your LinkedIn strategy, and elevate your professional
presence. Keep exploring and stay ahead!