StoreFries Analytics for YouTube
Analyzing the performance of your YouTube channel is now made easy with StoreFries analytics. Gain valuable insights into your video content through a range of comprehensive metrics and reports.
Summary
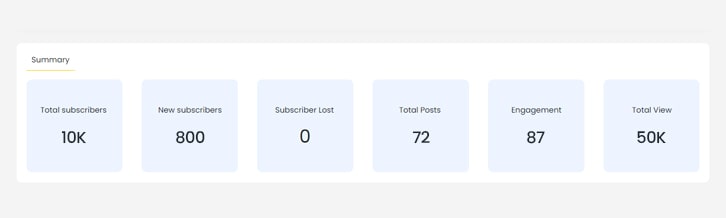
These analytics are crucial in understanding the performance and impact of your content on LinkedIn. By monitoring these metrics, you can refine your content strategy to better engage your audience and achieve your professional goals.
Audience Summary
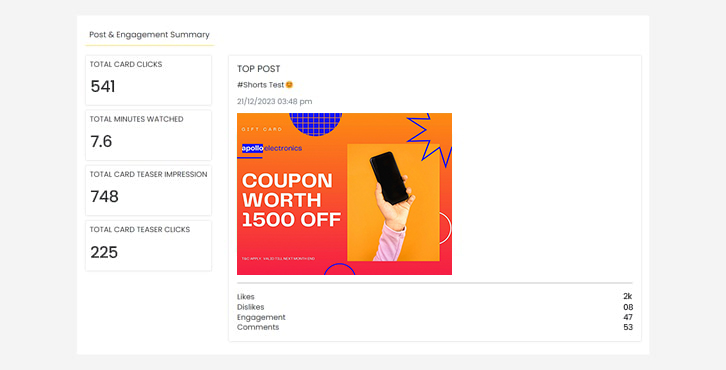
Post & Engagement Summary
Video Performance Summary
Cards Summary
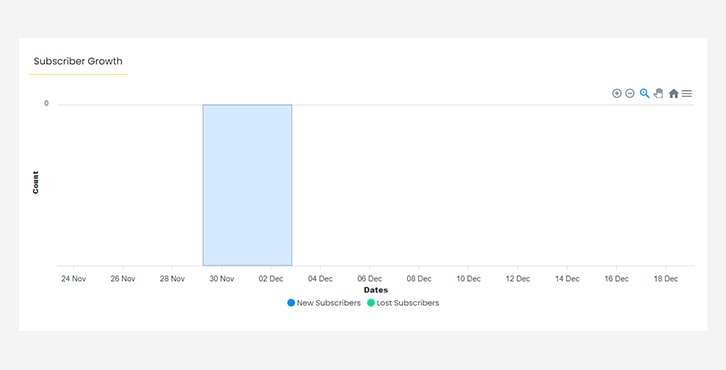
Subscriber Growth
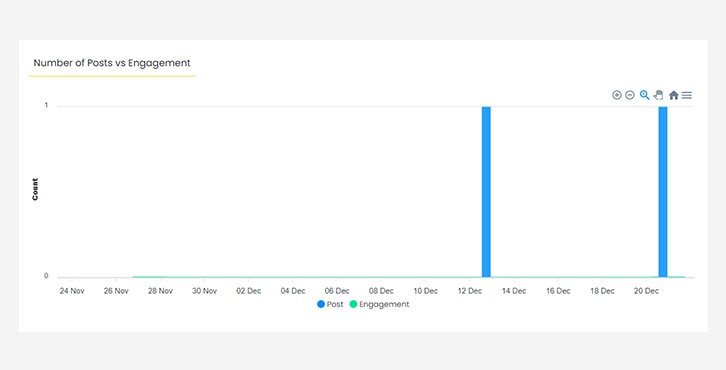
Posts & Engagement Reports
Number of Posts vs Engagement
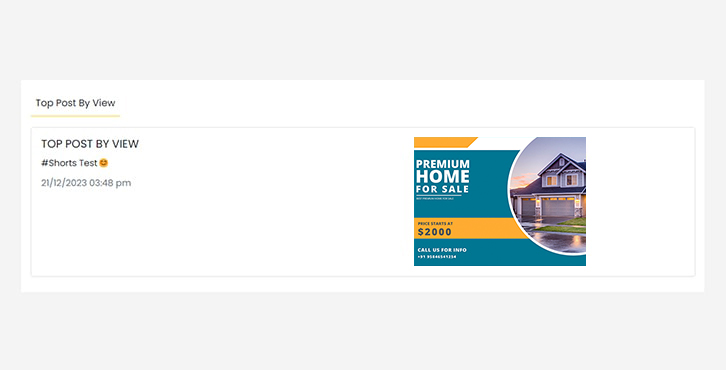
Top Videos
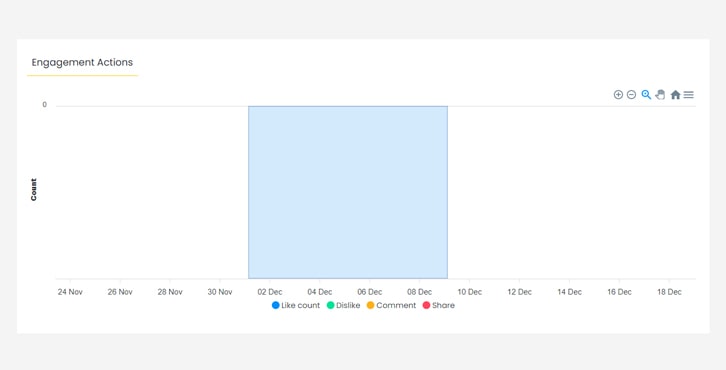
Engagement Actions
With StoreFries analytics, you're equipped with a powerful toolset to dive deep into your YouTube performance and optimise your content for maximum impact. Keep exploring and make your YouTube channel stand out!
Visualise Performance Over Time Frames:
This feature is the ability to filter data based on specific date ranges.
- Go to the Analytics module.
- In the top right corner there will be an option to select the time range.
- In the drop-down list, you can choose from Today, Yesterday, This week, last 28 days analytics report.
- click Analyze.
Note :
"Analytics is available only for pro plan users."
Page Views: